The field season has come to a close, and we're now ready to share some results with you from the first year of the California Bumble Bee Atlas!
Where we found the bees
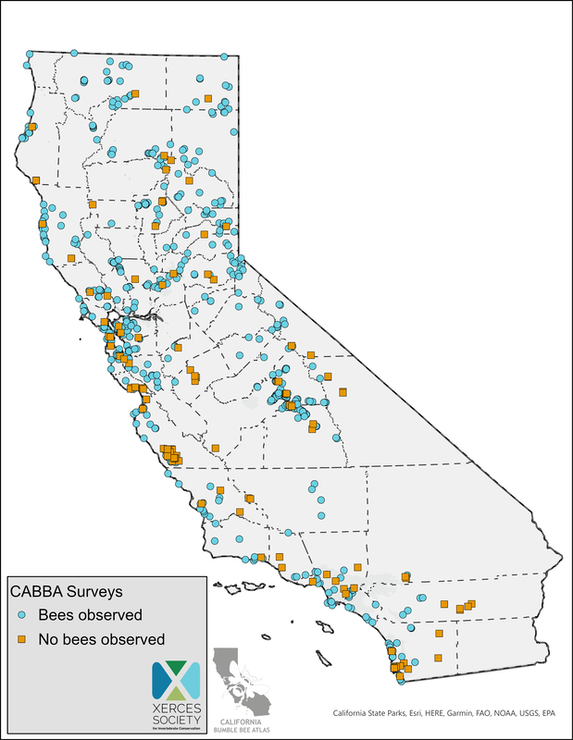
Volunteers and project staff conducted surveys in 154 of our 200 priority grid cells, making observations of 3,666 bumble bees! Of 25 native species historically found in California, we relocated 22, missing only B. franklini, B. suckleyi, and B. kirbiellus. We collected from a wide diversity of host plants--more than 425 species within 229 genera. Here's a map of all observations you submitted to Bumble Bee Watch in 2022:
Volunteers and project staff conducted surveys in 154 of our 200 priority grid cells, making observations of 3,666 bumble bees! Of 25 native species historically found in California, we relocated 22, missing only B. franklini, B. suckleyi, and B. kirbiellus. We collected from a wide diversity of host plants--more than 425 species within 229 genera. Here's a map of all observations you submitted to Bumble Bee Watch in 2022:
Comparing our work to historical collections
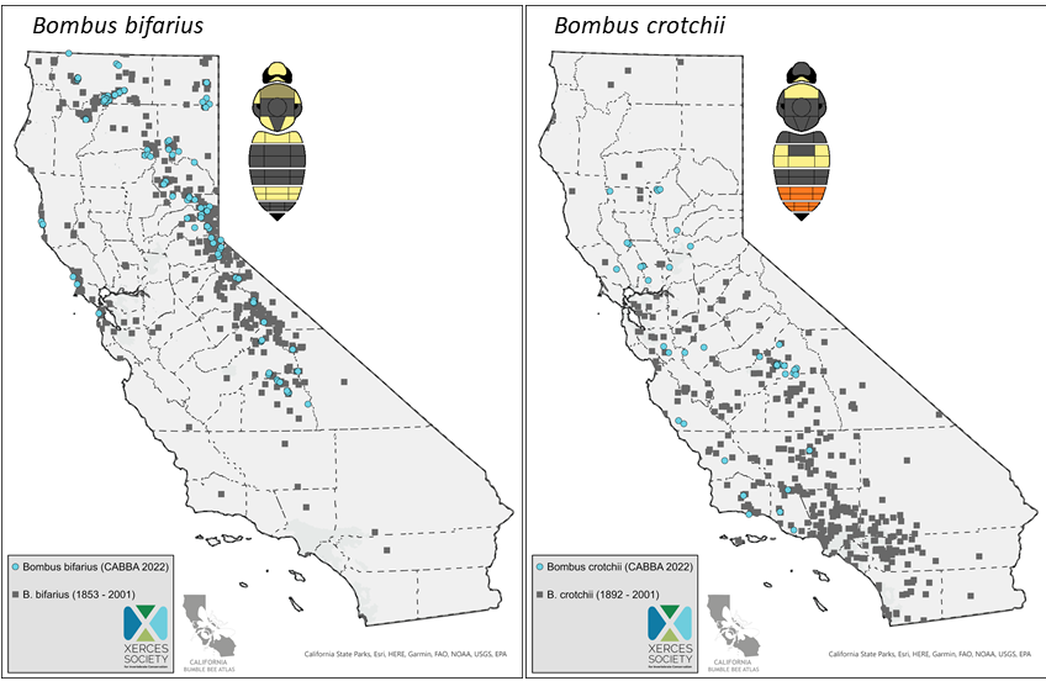
How do our observations of California bumble bees compare with their historical distributions? Here are two examples, using one common species (Bombus bifarius) and one that is in decline (B. crotchii). In each case, our 2022 data is plotted in blue circles over gray squares, which represent "historic" observations (i.e., those made before 2002*). We found B. bifarius over much of its former range, however, the bee seems to be less common in the San Francisco Bay Area than in the past, and it did not turn up in surveys of Southern California montane sites. We found B. crotchii sparingly over the Central Valley and coast ranges, but surprisingly, did not make any observations in or around San Diego, where it is vouchered in most years. We clearly have more work to do for both of these species, and these maps can guide our decisions about where to focus survey time in 2023.
*These data come from the Bumble Bees of North America Database, a repository of specimen and photo-based bumble bee observations. We have chosen not to depict the last 20 years of data in these plots in order to emphasize differences between our survey and the "historical" baseline. Learn more here.
Species (relative) abundance in the data
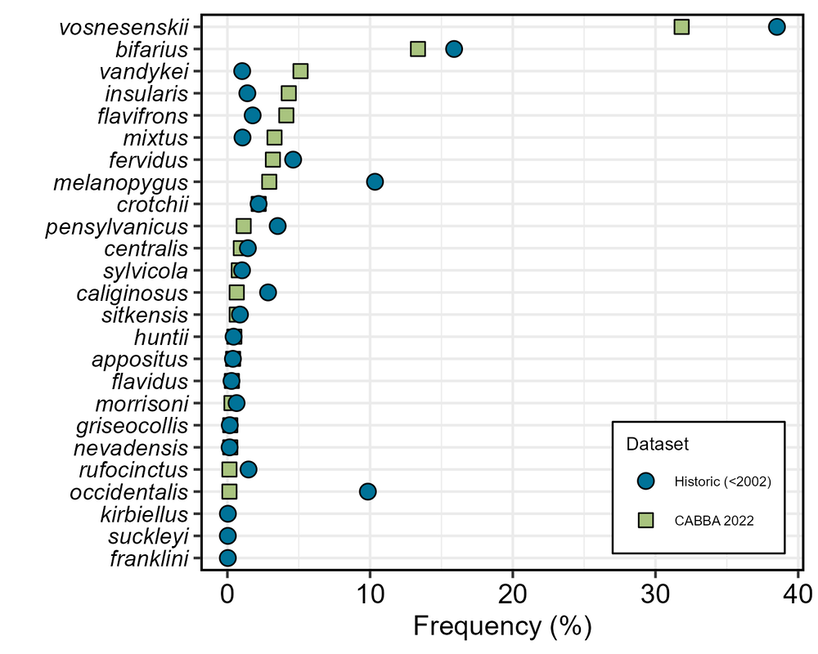
One way of understanding the California Bumble Bee Atlas results is to compare species by frequency (or relative abundance) in the data. The graph below shows the percent of identifiable records in the CABBA dataset that are accounted for by each species (green squares). As you can see, B. vosnesenskii is by far the most common bumble bee species in California, while others, such as B. franklini, were not encountered at all. How do our 2022 observations compare to historical patterns in the state? The blue circles depict the frequency of bumble bees collected in the state during the historical time period (defined here as records from before 2002). Comparing CABBA with this historical baseline, we can see that some species appear to have increased in relative commonness (e.g., B. vandykei), while others have declined (e.g., B. pensylvanicus).
As you now know, it can be very difficult to distinguish Bombus caliginosus and B. vosnesenskii, and many observations of this species pair could not be resolved to a species identification. We have removed these unidentifiable bees from this graph for clarity; however, if we were to assume that most of these are truly B. vosnesenskii observations (a reasonable assumption), the frequency of that species appears to have greatly increased over time! That said, as we dig into this data further, we can estimate from your point surveys the actual abundance of each species in the field (not just relative abundance across a dataset), something we cannot do with the historic data. Stay tuned for more insights on this as the project moves forward!
What they ate
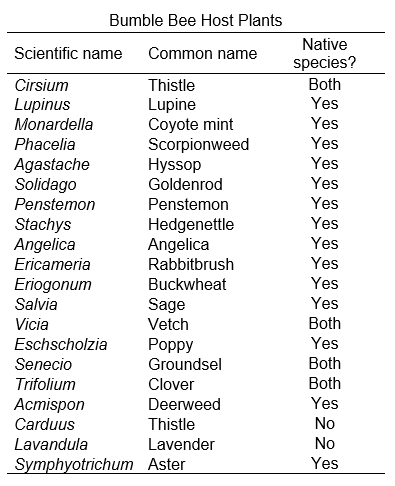
Together, we observed bumble bees on more than 425 native and non-native plant species, representing 229 different plant genera! Because we don't know the species name for many observations, here we summarize some of this information at the level of genus. In the table below, you'll see the top 20 most important plant genera for California bumble bees, as reflected by their commonness in our data. We have included some information on whether or not the plants are native to California. If we recorded bumble bees using both native and non-native members of a genus, we note in the table below that both were present (e.g., the thistle genus Cirsium includes cobwebby thistle, a common native plant, and bull thistle, a problematic invasive). We can use this list as an index of bumble bee plant preference, which might be useful in habitat restoration efforts. However, the list also reflects the places we surveyed, which are not fully reflective of the diversity of plant habitats across the state.
Together, we observed bumble bees on more than 425 native and non-native plant species, representing 229 different plant genera! Because we don't know the species name for many observations, here we summarize some of this information at the level of genus. In the table below, you'll see the top 20 most important plant genera for California bumble bees, as reflected by their commonness in our data. We have included some information on whether or not the plants are native to California. If we recorded bumble bees using both native and non-native members of a genus, we note in the table below that both were present (e.g., the thistle genus Cirsium includes cobwebby thistle, a common native plant, and bull thistle, a problematic invasive). We can use this list as an index of bumble bee plant preference, which might be useful in habitat restoration efforts. However, the list also reflects the places we surveyed, which are not fully reflective of the diversity of plant habitats across the state.
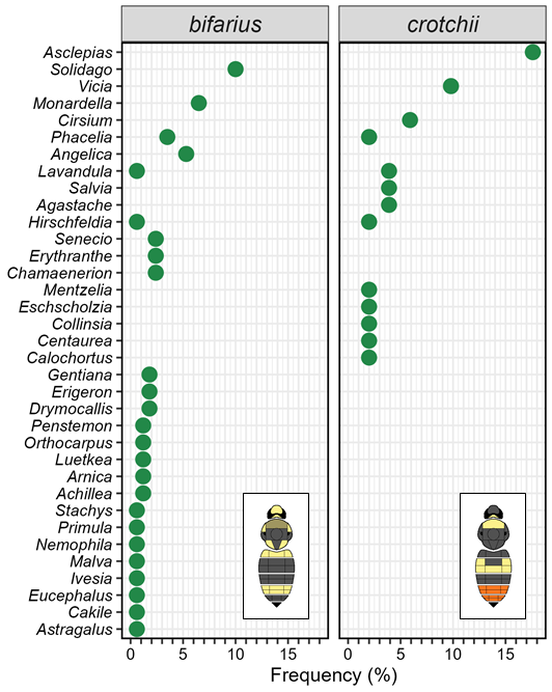
Did different species of bees favor different host plants? Yes, they did! As one example, the graph below compares host plant use by B. bifarius, a species found in northern mountains, the Sierra Nevadas, and on the North Coast, with B. crotchii, found mostly at lower elevation in Central and Southern California. The plants are sorted in terms of their mean frequency as hosts for this pair of bees, and a missing dot means the bee did not use that plant at all. We can immediately see big differences between the two: the most important plants for B. crotchii were milkweeds (Asclepias species), while B. bifarius didn't use this plant at all, and often favored goldenrod (Solidago species). These difference must in part reflect geographic differences between ranges of the two bees, but it looks like we've also documented genuine differences in host plant preferences in our first year of the Atlas!
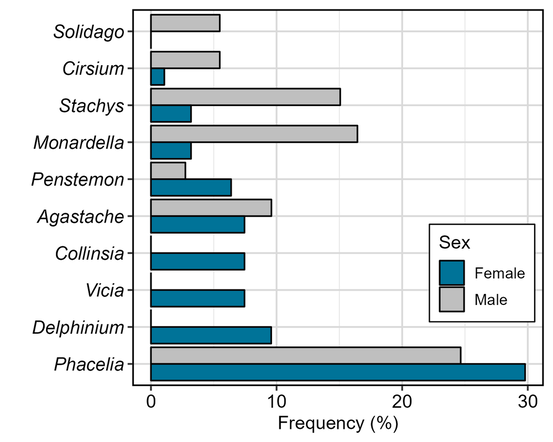
Interestingly, we have discovered some differences in host plant preference between males and females of the same species. Again using B. bifarius as an example, the graph below shows the observation frequency of some of the most important host plants for males and females. We can see that some plants--Phacelia, for example--are important to both sexes, while others are more important to males (e.g., Monardella) or females (e.g., Delphium). This is most likely because of phenological (i.e., timing) differences between when sexes are active, and because only females forage for pollen, which is not always found at the same plants where both sexes gather nectar.
Are you interested to learn more about our 2022 season and the data we collected?
Click here for page 2 of our project highlights!
Credits: bumble bee species thumbnail graphics on this page from Williams et al. 2014, Bumble Bees of North America: an Identification Guide.
